
Recent research by the National Association of Realtors (NAR) examined certain red flags that caused the housing crisis in 2005, and then compared them to today’s real estate market. Today, we want to concentrate on four of those red flags.
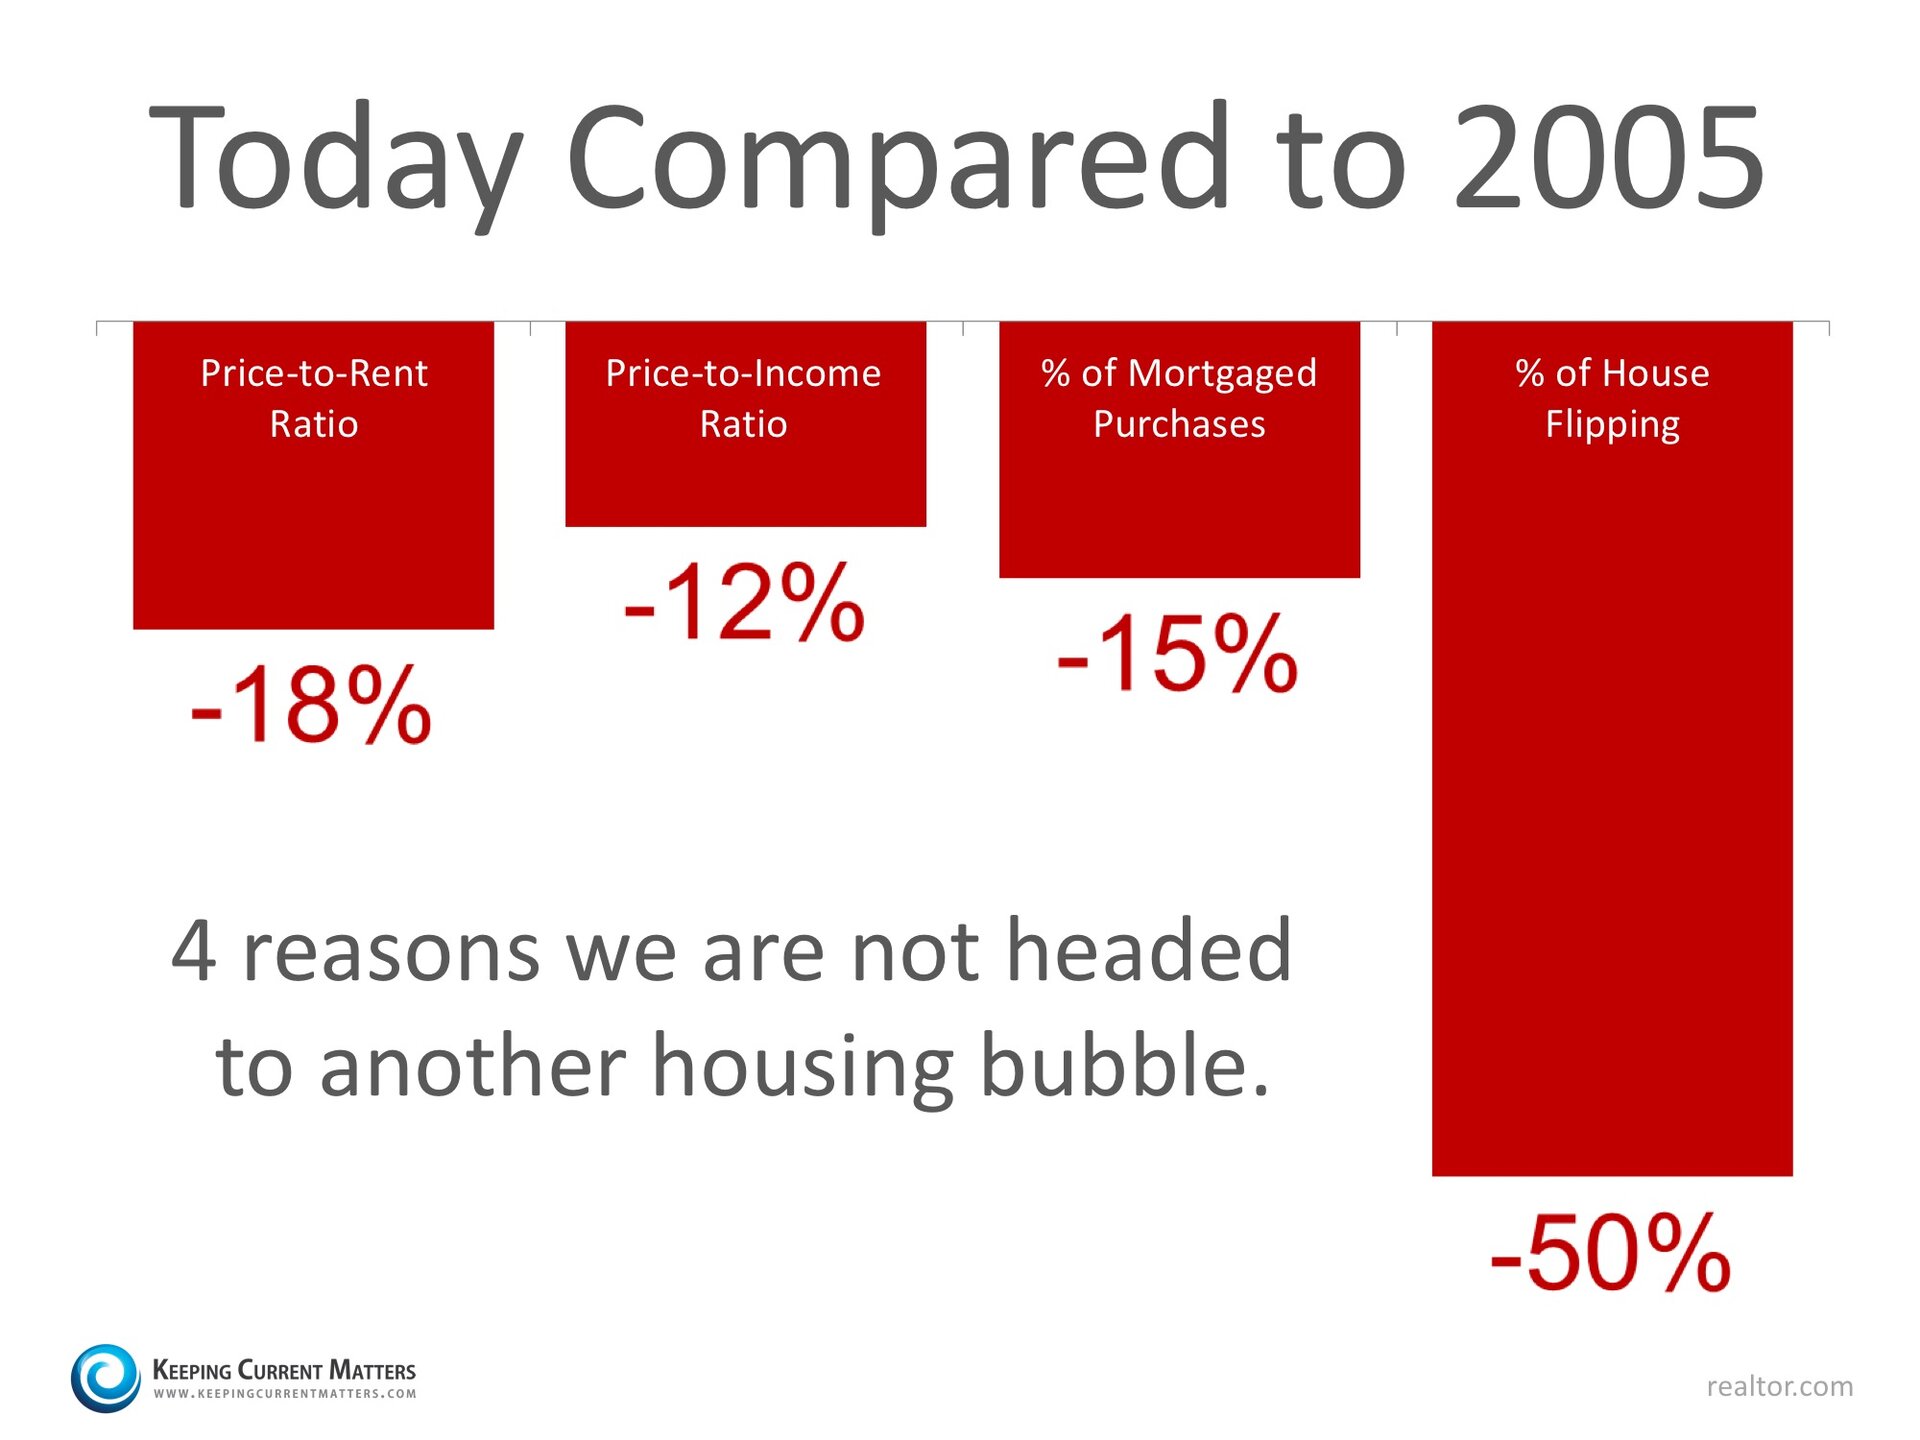
- Price to Rent Ratio
- Price to Income Ratio
- Mortgage Transactions
- House Flipping
All four categories were outside historical norms in 2005. Home prices were way above normal ratios when compared to both rents and incomes at the time.
<< SEARCH FORT LAUDERDALE HOMES FOR SALE >>
NAR explained that mortgage transactions as a percentage of all home sales were also at a higher percentage:
“Loose credit was one of the main culprits of the housing crisis. Mortgage lending expanded dramatically as unhealthy housing speculation reached its peak and was met by the highest level of credit availability as measured by the Mortgage Bankers Association. The index measures the overall mortgage credit condition by the share of home sales financed by mortgages. This metric does not capture credit quality, but it does set a view of the importance of financing in supporting the housing market.”
House flipping was rampant in 2005. As NAR’s research points out:
“Heightened flipping activity is a clear indication of speculation in the real estate market. A property is considered as a speculative flip if the property is sold twice within 12 months and with positive profit. Flipping is a normal part of a healthy housing market. In an inflated housing market, expectations about short-term profit from pure price appreciation are very high; therefore, the level of flipping activity would show evidence of being heightened.”
Here are the categories with percentages reflecting the unrealistic ratios & numbers of 2005 as compared to the current market. Remember, a negative percentage reflects a positive gain for the market.
Bottom Line
They say hindsight is 20/20… Today, experts are keeping a close watch on the potential red flags that went unnoticed in 2005. Keep in mind the media typically reports on the real estate news for an entire company and in my experience they don't look at actual closed sales, which in Broward County have been steady for the past decade! Typically the report on the number of active homes for sale which doesn't always sell, however that is the most dramatic change in the real estate business by numbers is typically the amount of inventory for sale.
To find out the true story in your local neighborhood contact a local realtor who can show you the data and is trained to interpret the market and what's happening locally. You wouldn't be happy if a weather man told you it's 75 and sunny all throughout America....so why do we believe the news when they say whats happening to the real estate market in the U.S.?
I study the Real Estate Market Nationally, then by County, then by City, and then when it comes to the purchase or sale of your house I narrow down to the most recent sales and study the trends for that neighborhood.
Contact Jay Cermak Top Fort Lauderdale Real Estate Agent with Keller Williams at 954.235.3589 and schedule a FREE Real Estate consultation.
Serving all of your South Florida and Fort Lauderdale Real Estate Needs!
No comments:
Post a Comment